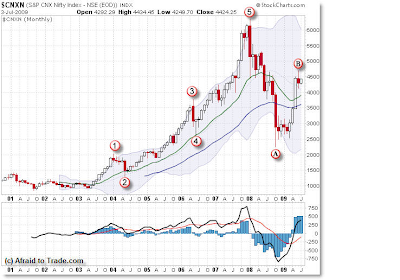

,,,,,,,,,,,,,,,,,,,,,,,,,,,,,,,,,,,,,,,,,,,,,,,,,,,,,,,,,,,,,,,,,,,,,,,,,,,,,,,,,,,,,,,,,,,,,,,,,,,,,,,,,,,,,,,,,,Per multiple reader request (thank you to all my followers in India!), I am updating my analysis on Indias Nifty 50 Index, beginning this week with the long-term 10-year Monthly Structure.Lets take a quick look at a possible large-scale Elliott Wave count and also a Fibonacci Confluence (three price levels) chart on the monthly timeframe - a key turning point may be ahead soon.The market rallied sharply off the 2003 lows near 1,000 and peaked in January 2008 at a price high of 6,350 - an absolutely impressive rise to be sure.Look closely and you can see an arc rise (not drawn) off these lows as price went parabolicin its last few months - a classic warning of a top being formed.We see the Elliott Wave count (from 1 to 5) as the market rose 600% in value. We now appear to be in a corrective phase, and perhaps are finishing the (second) wave of a larger corrective move to retrace a larger portion of this price rise.This count would assume that the final Corrective wave down is on the horizon, which could take price back down to test the 2,500 level yet again in the months and perhaps next year to come.We have already retraced 61.8% of the move from the 2003 lows to the 2008 highs, so perhaps the corrective phase has run its course - that would be the alternate scenario.The alternatescenario would assume that instead of the 5-wave decline I have labeled as ,
instead had a complex corrective move down - perhaps in the order of ABC - X - ABC to end the correction, which places us squarely in Wave 1 now of a new bull market and expecting a corrective Wave 2 down (not to the lows - but perhaps to the 3,500 level) to begin.I think it counts better as a correction instead of a new bull market, but we need to be open to this possibility.Either way,
the Next Likely Swing appears to be a down one, whether it be the final Wave C or just a corrective Wave 2 - that is where I find Elliott Wave helpful - not in absolute forecasting, but in confluence counting in regards to the next likely swing.Speaking of confluence, lets take a look at a Confluence Fibonacci Grid using three price lows to begin our retracement to the closing high in January 2008.Two of the 3 grids overlap about the 4,400 level, which you see is exactly where price is located now.In fact, that is the only major overlapping confluence level we see using these grids on the chart.This implies that price is at a critical node and could be unable to overcome this confluence level to the upside - in other words, it could serve as key resistance.Last month also formed a Spinning Top candle, which is often seen and associated with key turning points in a market.As a caveat, there no guarantee of any absolute prediction into the future, but for now, we have the following
:
Possible Wave C (or Wave 2) down about to beginPrice at a critical Fibonacci Confluence Node around 4,400A Spinning Top candle formed in June on the confluence nodeA solid close above 4,800 and especially 5,000 would overrule these bearish omens, but until then, it might pay to be defensive on the long side at these levels
, understanding that the Nifty is at confluence resistance ties into the thesis that the S&P 500 is forming a possible reversal pattern down (Monthly signal and also Daily Head and Shoulders with momentum/volume divergences) - and adds a layer of confirmation that both markets appear poised for corrections)
.Corey Rosenbloom
CMTAfraid to Trade.com