
Tuesday, September 27, 2011
Monday, September 26, 2011


Sunday, September 25, 2011


Saturday, September 24, 2011

Friday, September 23, 2011


શુ 2008 જેવુ ભારે કડાકા વાળુ કરેકશન 2011 મા પણ શક્ય છે ખરુ?
જવાબ ---- ના તેવુ શક્ય નથી..કારણ કે 2008 મા જે હેજ ફન્ડો બેન્ક કે તેવી ફાયનાન્સ સન્સ્થા ઓ કે જે આ માર્કેટ ને ચલાવે છે.તે લોકો પાસે હાથ પર પૈસા નહોતા કે જેની મદદ વડે તેઓ કાયમ આખી દુનિયા ના માર્કેટો ચલાવતા હતા.સબ પ્રાઇમ પ્ર્રોબ્લેમ ને લીધે તેમની પાસે રોજે રોજ વહેવાર ચલાવવાના પૈસા ખુટી પડ્યા હતા તેથી 2008 મા તેમને ફરજીયાત તેમનુ લાબા ગાળાનુ ઇન્વેસ્ટમેન્ટ પણ વેચી ને ટકવાનુ હતુ નહિતર કાયમ માટે બન્ધ થઇ જાય તેવી પરિસ્થિતિ હતી.ડુ ઑર ડાઇ જેવી પરિસ્થિતિ હતી.જ્યારે 2011 મા તેઓ કૅશ થી ભરપુર છે.તેઓ નાદાર થઇ જાય તેવી 2008 જેવી પરિસ્થિતિ નથી.અત્યારે અમેરિકન ઇકોનોમી સ્લૉ ડાઉન મા છે.હજુ મન્દી શરુ નથી થઇ પણ મન્દી નો હાઉ ઉભો છે..અમેરિકન ગવરમેન્ટ ને કોઇ કાળે તેમના સ્ટોક માર્કેટો મા મન્દી થાય તે સ્વિકાર્ય નથી..તેથી જ્યારે જ્યારે માર્કેટ મન્દી તરફ જવાનુ ચાલુ કરે છે કે તરત ડૉલર છાપી છાપી આ ઍફ.આઇ.આઇ અને બીજી સન્સ્થાઓ ને ખુબ તાકાત આપી દે છે.અને સ્ટોક માર્કેટો મા પ્રાણ પુરે છે
Is similar to 2008 crash like correction possible in 2011?
Answer- 2008 was very worst with most of american banks down by subprime, this time its economy slow down and budget deficit, but things are not that much worse it was in 2008.
In 2008 liquidity problems for hedge funds mostly runs by big fiis,, almost all big institutions along with govt were starving for liquid funds ,In 2011 they all are cash rich,further more american govt starts money printing when ever their stockmarket starts crash like situation.Govt puts more money on the hands of big banks,financial institutions and hedge funds.american govt does not allows their stock markets go for big bearish mode.always remember its economy slowdown not recession yet.
In 2008 liquidity problems for hedge funds mostly runs by big fiis,, almost all big institutions along with govt were starving for liquid funds ,In 2011 they all are cash rich,further more american govt starts money printing when ever their stockmarket starts crash like situation.Govt puts more money on the hands of big banks,financial institutions and hedge funds.american govt does not allows their stock markets go for big bearish mode.always remember its economy slowdown not recession yet.
Thursday, September 22, 2011


Wednesday, September 21, 2011


Tuesday, September 20, 2011

20-9 after mkt hourly chart
mkt had kept, it self with the bigger picture ..lefts many small waves so many times..it is because ,during the intraday time our mkt is running in line with the global mkts candle by candle,,,,, majority times,,,,or some times ignores the global mkt copmpletely and follows the ew counts.so we have to live with this kind of situation any how. .keeps us buisy to change our small wave counts according to running situation. if smaller wave count not match with the bigger one, and heavily ambiguous, than it is our duty to stick with the bigger counts,but for trading point of view we are swing traders so it does not harmful for us..
but for sharp entry exit points and sharp stoploss calculation,small 5 minutes or 15 minutes counts helps us enough.
 ..lefts many small waves so many times..it is because ,during the intraday time our mkt is running in line with the global mkts candle by candle,,,,, majority times,,,,or some times ignores the global mkt copmpletely and follows the ew counts.so we have to live with this kind of situation any how. .keeps us buisy to change our small wave counts according to running situation. if smaller wave count not match with the bigger one, and heavily ambiguous, than it is our duty to stick with the bigger counts,but for trading point of view we are swing traders so it does not harmful for us..
but for sharp entry exit points and sharp stoploss calculation,small 5 minutes or 15 minutes counts helps us enough.
Monday, September 19, 2011

Friday, September 16, 2011
16-9 after market prediction for 19-9 monday

market will try go get support at 5040,5060, level and than up move expected.tgt is 5180,5200 zone.
market left the down move

market left the expected move prescribed in last day's chart.so it had opened the positive count possibility shown here in hourly chart.considering eliott wave rules change in count is possible.
Bullish possibilty opened today
bullish possibility opened today,because market left the expected down move,so we have added new count possibilty also.now recent up from 4720 is either first wave of new bull run,or it is the ABC part of XX wave ,the temporary up wave in bearish market. till the last day it is only abc-x-abc kind xx wave.now from today with the necessary change in count bullish possibilty also opened.
 till the last day it is only abc-x-abc kind xx wave.now from today with the necessary change in count bullish possibilty also opened.
Thursday, September 15, 2011
15-9 next day prediction

Tomorrow 16-9-2011 market will try to go down.5080,5100 is the level where we can identify mkt direction clearly.if mkt opens above this zone than buying zone start for tgt 5170,5225..most likely mkt will re test 4920 to 4880 tgt zone.

Wednesday, September 14, 2011


Tuesday, September 13, 2011


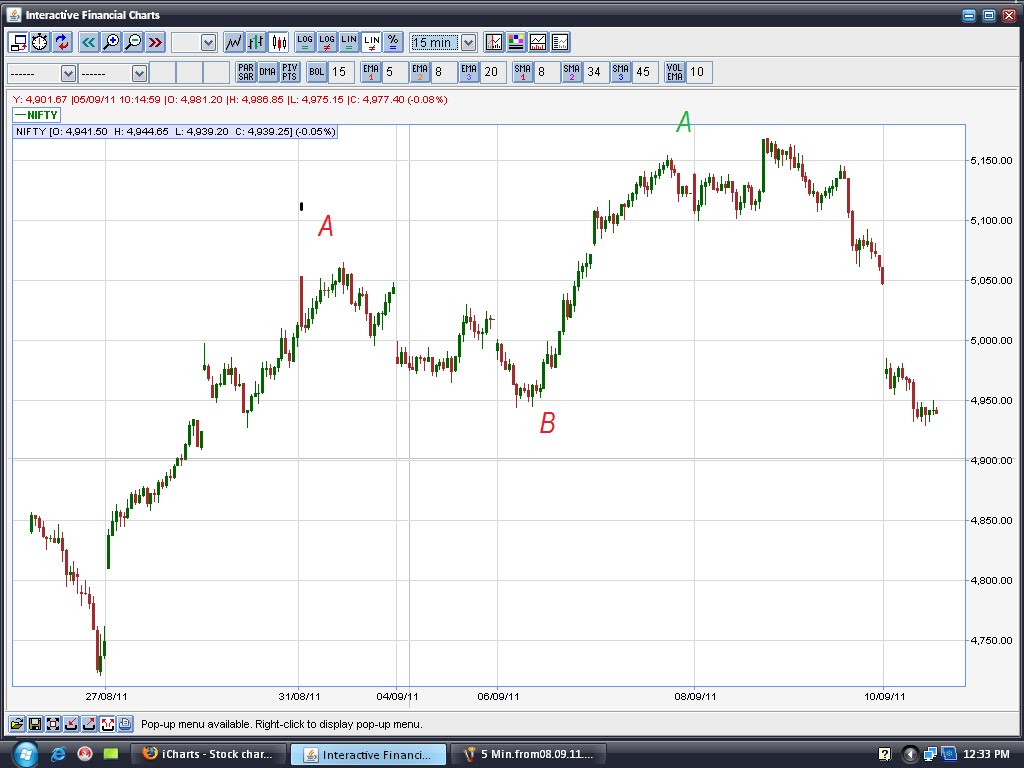
13-9 1minute 2nd update

after completing our first tgt 5030 mkt now at down ward move for 4900,4905,4910...and than again up move expected.tgt 4965,4970,4978...

Monday, September 12, 2011


Tuesday, February 9, 2010
USA economy towards bankruptcy,usa economy in deep trouble says big peoples of world.
see all this world great traders and investors says about USA economy and stockmarket's next action.
 February 5, 2010
US Government Will Go Bankrupt But Before That We Will Have High Inflation
“Maximum within 10 years time more than 35% of tax revenues will have to be used to pay the interest on the government debt and then you are in trouble – because then there will be not enough money out of the budget to pay for other stuff. I’m convinced the US government will go bankrupt, but not tomorrow. And before they go bankrupt, they’ll print money, and then you get high inflation rates, you have a depression and eventually they’ll go to war.”
in rt.comMarc Faber is an international investor known for his uncanny predictions of the stock market and futures markets around the world. Dr. Doom also trades currencies and commodity futures like Gold and Oil.
Unemployment Is Up, Bankrupcies Continue To Increase In The US. So People Are Not Better Off.
"I want to remind you basically, if you ask me this is all part of a continuing. Yes, the stock market went up. You know, the american stock market is around 10,000 right now, the Dow Jones Average. It can go to 30,000 if they continue to print money. You think you made money because the Dow Jones tripled. But it has tripled in worthless paper. So we are not going to be better off and that is part of what is happening now. The stock market has gone up but the value of the money is deteriorating. Look at what has happened to the price of gold, or silver or some other commodities. They have been very strong because people know that the paper money is becoming less valuable. You may think that if the stock market goes to 20,000 you are better off, but you are not. The stock market is up a lot, around 50%. But unemployment is up, bankrupcies continue to increase in the US. So people are not better off. The stock market is better, stockbrokers are better because they have all the money. And that is not a good system. That is socialism for the rich."in
 February 5, 2010
US Government Will Go Bankrupt But Before That We Will Have High Inflation
“Maximum within 10 years time more than 35% of tax revenues will have to be used to pay the interest on the government debt and then you are in trouble – because then there will be not enough money out of the budget to pay for other stuff. I’m convinced the US government will go bankrupt, but not tomorrow. And before they go bankrupt, they’ll print money, and then you get high inflation rates, you have a depression and eventually they’ll go to war.”
in rt.comMarc Faber is an international investor known for his uncanny predictions of the stock market and futures markets around the world. Dr. Doom also trades currencies and commodity futures like Gold and Oil.
George Soros: Real Threat Of A Double Dip Recession In The United States
George Soros sees a real threat of a double dip recession in the United States because there is increasing concern about the budget deficit and the growing national debt and that diminishes the chances of additional stimulus:"The markets are now stabilized. The premiums have shrunk back to normal levels. So that's fine. And the economy has begun to move forward. But it's only moving forward because it's pushed by the stimulus. And that's particularly true in the United States. At the same time now, there's increasing concern about the budget deficit and the growing national debt. And that will stand in the way of additional stimulus. And that creates-- I think a real threat-- of a double
Feb 3, 2010
George Soros sees a real threat of a double dip
 recession in the United States because there is increasing concern about the budget deficit and the growing national debt and that diminishes the chances of additional stimulus:"The markets are now stabilized. The premiums have shrunk back to normal levels. So that's fine. And the economy has begun to move forward. But it's only moving forward because it's pushed by the stimulus. And that's particularly true in the United States. At the same time now, there's increasing concern about the budget deficit and the growing national debt. And that will stand in the way of additional stimulus. And that creates-- I think a real threat-- of a double
Feb 3, 2010
Paul Volcker`s Plan To Fix The Financial System
Paul Volcker expose d his plan to fix the financial system in a NY Times op-ed this weekend. Here are the plan`s highlights:1 - Prevent banks from owning hedge funds and other proprietary trading vehicles 2 - Give the government resolution authority to step in, liquidate, or sell any firm it deems to be in trouble3 - Make shareholders, management, and bondholders pay for any costs associated with thisThis plan is targeted to solve the "Too Big To Fail" issue. Under Volcker's plan, big firms would be allowed to fail in an orderly fashion, with their owners and lenders taking the hit.
Paul Volcker expose
 d his plan to fix the financial system in a NY Times op-ed this weekend. Here are the plan`s highlights:1 - Prevent banks from owning hedge funds and other proprietary trading vehicles 2 - Give the government resolution authority to step in, liquidate, or sell any firm it deems to be in trouble3 - Make shareholders, management, and bondholders pay for any costs associated with thisThis plan is targeted to solve the "Too Big To Fail" issue. Under Volcker's plan, big firms would be allowed to fail in an orderly fashion, with their owners and lenders taking the hit.
 Jan 24, 2010
Richard R ussell: Very Bearish On The Stock Market Going Forward
Richard Russell, author of The Dow Theory Letters, is very bearish on the stock market going forward. This is an excerpt of his latest stock market comments:"The sinking market is taking a lot of late-arrivals along with it; These are the poor souls who bought stocks hoping to recoup some of the losses they suffered during 2008-09. The falling stock market, I believe, will turn consumers even more sceptical and bearish than they have been. Today, by the way, the Dow and the Transports both closed below their 50 day moving average, this for the first time since last November.Despite it all, I continue to believe that since March we have been in a bear market correction, and not a new bull market. For this reason, I take the current rotten market action very seriously. If I’m correct, it this is the beginning or a top-out in a bear market rally, then I can tell you that the “fun’s over,” and the really bad times lie ahead.What I’m now trying to decide is whether this is just a short-term correction or whether we are seeing a serious top-out of the rise from the March lows. A bearish turn of events would be an initial decline, then a weak rally and a second decline violating the lows of the first decline. In other words, a definitive downward pointing zig-zag.The Dow has now wiped out all of its 2010 gains and now shows a loss for the year, but more about the meaning of this tomorrow. Subscribers who wondered why I didn’t want to put the bull in the box may now see my hesitation. Bear market rallies turn on a dime, and in a few sessions you can be under water. I want my subscribers to be in the best shape possible if or when this market “has had it.” A few more weeks like this one, and we could see a real old-fashioned panic.The VIX is 22, which tells us that nobody has been buying puts. Confidence and complacency are the mood of the day. Nobody’s ready for a lousy market ahead."
Richard R
 ussell: Very Bearish On The Stock Market Going Forward
Richard Russell, author of The Dow Theory Letters, is very bearish on the stock market going forward. This is an excerpt of his latest stock market comments:"The sinking market is taking a lot of late-arrivals along with it; These are the poor souls who bought stocks hoping to recoup some of the losses they suffered during 2008-09. The falling stock market, I believe, will turn consumers even more sceptical and bearish than they have been. Today, by the way, the Dow and the Transports both closed below their 50 day moving average, this for the first time since last November.Despite it all, I continue to believe that since March we have been in a bear market correction, and not a new bull market. For this reason, I take the current rotten market action very seriously. If I’m correct, it this is the beginning or a top-out in a bear market rally, then I can tell you that the “fun’s over,” and the really bad times lie ahead.What I’m now trying to decide is whether this is just a short-term correction or whether we are seeing a serious top-out of the rise from the March lows. A bearish turn of events would be an initial decline, then a weak rally and a second decline violating the lows of the first decline. In other words, a definitive downward pointing zig-zag.The Dow has now wiped out all of its 2010 gains and now shows a loss for the year, but more about the meaning of this tomorrow. Subscribers who wondered why I didn’t want to put the bull in the box may now see my hesitation. Bear market rallies turn on a dime, and in a few sessions you can be under water. I want my subscribers to be in the best shape possible if or when this market “has had it.” A few more weeks like this one, and we could see a real old-fashioned panic.The VIX is 22, which tells us that nobody has been buying puts. Confidence and complacency are the mood of the day. Nobody’s ready for a lousy market ahead."
February 3, 2010
Unemployment Is Up, Bankrupcies Continue To Increase In The US. So People Are Not Better Off.
"I want to remind
 you basically, if you ask me this is all part of a continuing. Yes, the stock market went up. You know, the american stock market is around 10,000 right now, the Dow Jones Average. It can go to 30,000 if they continue to print money. You think you made money because the Dow Jones tripled. But it has tripled in worthless paper. So we are not going to be better off and that is part of what is happening now. The stock market has gone up but the value of the money is deteriorating. Look at what has happened to the price of gold, or silver or some other commodities. They have been very strong because people know that the paper money is becoming less valuable. You may think that if the stock market goes to 20,000 you are better off, but you are not. The stock market is up a lot, around 50%. But unemployment is up, bankrupcies continue to increase in the US. So people are not better off. The stock market is better, stockbrokers are better because they have all the money. And that is not a good system. That is socialism for the rich."in
 Praag Meeting
February 2, 2010
February 2, 2010
Jim Rogers, a native of Demopolis, Alabama, is an author, financial commentator and successful international investor. He has been frequently featured in Time, The Washington Post, The New York Times, Barron’s, Forbes, Fortune, The Wall Street Journal, The Financial Times, and most publications dealing with the economy or finance
Jan 17, 2010
Warren Buffett's Favorite Economic Indicator Shows Weak Economy
Warren Buffet t's favorite indicator shows a weak US Economy:Rail traffic continues to show signs of a very tepid economic recovery as carloads and intermodal rail traffic got off to slow starts to the new year. Total carloads were off 12.7% compared to 2008 while intermodal traffic declined 3.6%. The breadth of the weakness continued to narrow, however, as 11 of the 19 commodity groups were up compared to 2008.This weakness in rail data was best displayed by yesterday’s Railtime Indicators Report from the AAR which showed the weakest annual rail data in over 20 years. While the sequential trend continues to improve there is little doubt that the recovery is still very weak.I would also like to add his recent comments about inflation, "the government's efforts to paper over the banking crisis are potentially very inflationary......worse than the 1970s inflation."
Warren Buffett's Favorite Economic Indicator Shows Weak Economy
Warren Buffet
 t's favorite indicator shows a weak US Economy:Rail traffic continues to show signs of a very tepid economic recovery as carloads and intermodal rail traffic got off to slow starts to the new year. Total carloads were off 12.7% compared to 2008 while intermodal traffic declined 3.6%. The breadth of the weakness continued to narrow, however, as 11 of the 19 commodity groups were up compared to 2008.This weakness in rail data was best displayed by yesterday’s Railtime Indicators Report from the AAR which showed the weakest annual rail data in over 20 years. While the sequential trend continues to improve there is little doubt that the recovery is still very weak.I would also like to add his recent comments about inflation, "the government's efforts to paper over the banking crisis are potentially very inflationary......worse than the 1970s inflation."
 Thursday, November 12, 2009

Thursday, September 10, 2009
market will start down ward move for 14100,200 first target.
market at decisive mode... sensex target is 16557.....now market very near to it. most likely market will start down ward move from it.lower target is 14100 and 12800,12700.
if market want to continue it's up ward move than it has to close above 16600,,,for two three days constant.which has very rare possibility.
see sensex at second tgt zone in between 16550 to 16700,this is predicted very earlier in this blog(see chart posted in june 5 earlier post.)
time to be cautious.most likely mkt will take some time here as dowjones tgt of 10000,10300 not achieved yet, interesting to see is our mkt wait for dow or takes it's own way(probable down wave),
one thing is sure before down ward move start,,, one good whipsaw zone dull narrow ranged trading zone,good distribution zone expected as smart money wants offload at higher lvl always.
Monday, August 17, 2009
range bound market.
All our last predictions prove right.
1.'''''
i had predicted 15600 and 16500,700 as tgt for up move start from 8050,nifty similar tgt from 2700 t0 4600,4700.this prove right sensex made our first tgt point to point 15600 and than start correction.
2."""
in the area of correction again bounce of 15000 predicted.
this is also prove right.
3."""
again predicted down ward move after 15000, sensex touch 15100 and than down for 13220.
(all the past this predictions posts available here in this blog)
now the market at big range consolidation zone ,the range is 3700 to 4900.
valuations are little bit at higher band but too much liquidity from fii side keeps our mkt at higher zone.
Dow Jones will play major role for our mkt next action.Dow 9500 is big resistance cross over of it will leads Dow at 10300,400,we have to watch Dow Jones at 9500 and than if Dow start for 10400 it's effect on our mkt.
Sunday, July 5, 2009
afraid to trade.com elliot wave counts. similar to our count....


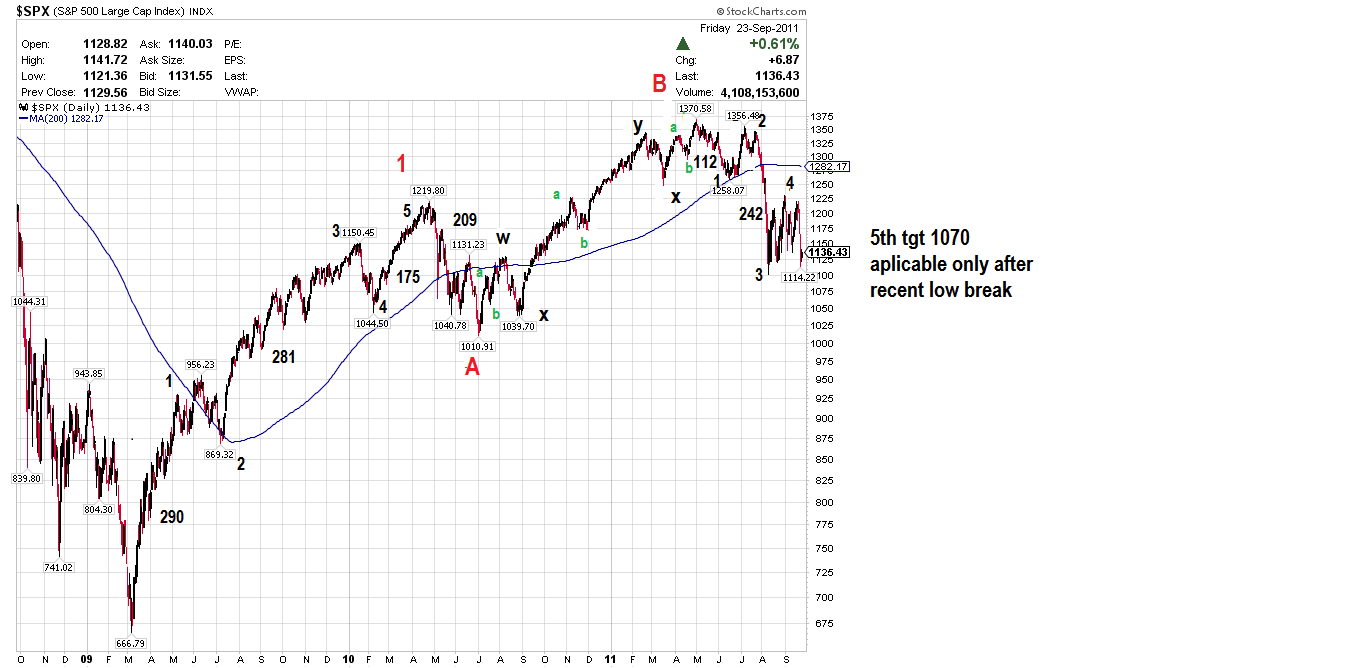
,,,,,,,,,,,,,,,,,,,,,,,,,,,,,,,,,,,,,,,,,,,,,,,,,,,,,,,,,,,,,,,,,,,,,,,,,,,,,,,,,,,,,,,,,,,,,,,,,,,,,,,,,,,,,,,,,,Per multiple reader request (thank you to all my followers in India!), I am updating my analysis on Indias Nifty 50 Index, beginning this week with the long-term 10-year Monthly Structure.Lets take a quick look at a possible large-scale Elliott Wave count and also a Fibonacci Confluence (three price levels) chart on the monthly timeframe - a key turning point may be ahead soon.The market rallied sharply off the 2003 lows near 1,000 and peaked in January 2008 at a price high of 6,350 - an absolutely impressive rise to be sure.Look closely and you can see an arc rise (not drawn) off these lows as price went parabolicin its last few months - a classic warning of a top being formed.We see the Elliott Wave count (from 1 to 5) as the market rose 600% in value. We now appear to be in a corrective phase, and perhaps are finishing the (second) wave of a larger corrective move to retrace a larger portion of this price rise.This count would assume that the final Corrective wave down is on the horizon, which could take price back down to test the 2,500 level yet again in the months and perhaps next year to come.We have already retraced 61.8% of the move from the 2003 lows to the 2008 highs, so perhaps the corrective phase has run its course - that would be the alternate scenario.The alternatescenario would assume that instead of the 5-wave decline I have labeled as ,
instead had a complex corrective move down - perhaps in the order of ABC - X - ABC to end the correction, which places us squarely in Wave 1 now of a new bull market and expecting a corrective Wave 2 down (not to the lows - but perhaps to the 3,500 level) to begin.I think it counts better as a correction instead of a new bull market, but we need to be open to this possibility.Either way,
the Next Likely Swing appears to be a down one, whether it be the final Wave C or just a corrective Wave 2 - that is where I find Elliott Wave helpful - not in absolute forecasting, but in confluence counting in regards to the next likely swing.Speaking of confluence, lets take a look at a Confluence Fibonacci Grid using three price lows to begin our retracement to the closing high in January 2008.Two of the 3 grids overlap about the 4,400 level, which you see is exactly where price is located now.In fact, that is the only major overlapping confluence level we see using these grids on the chart.This implies that price is at a critical node and could be unable to overcome this confluence level to the upside - in other words, it could serve as key resistance.Last month also formed a Spinning Top candle, which is often seen and associated with key turning points in a market.As a caveat, there no guarantee of any absolute prediction into the future, but for now, we have the following
:
Possible Wave C (or Wave 2) down about to beginPrice at a critical Fibonacci Confluence Node around 4,400A Spinning Top candle formed in June on the confluence nodeA solid close above 4,800 and especially 5,000 would overrule these bearish omens, but until then, it might pay to be defensive on the long side at these levels
, understanding that the Nifty is at confluence resistance ties into the thesis that the S&P 500 is forming a possible reversal pattern down (Monthly signal and also Daily Head and Shoulders with momentum/volume divergences) - and adds a layer of confirmation that both markets appear poised for corrections)
.Corey Rosenbloom
CMTAfraid to Trade.com
Saturday, June 27, 2009
sensex at down trend

- ,,,,,,,,,
- after achieving our sharp tgt of 15600 now sensex at down move.running is b wave of down move.... c down wave remain...will bring down the mkt again at lower lvl..
Friday, June 5, 2009

Subscribe to:
Posts (Atom)