DISCLAIMER

DISCLAIMER-All the views and contents mentioned in this blog are merely for my personal use,and are not recommendations or tips.i do not accept any liability/loss accuring from the use of any content from this blog.All readers of this blog must rely on their own discreation and neither any analyst nor any publisher shall be responsible for the outcome.

Tuesday, September 20, 2011

20-9 after mkt hourly chart

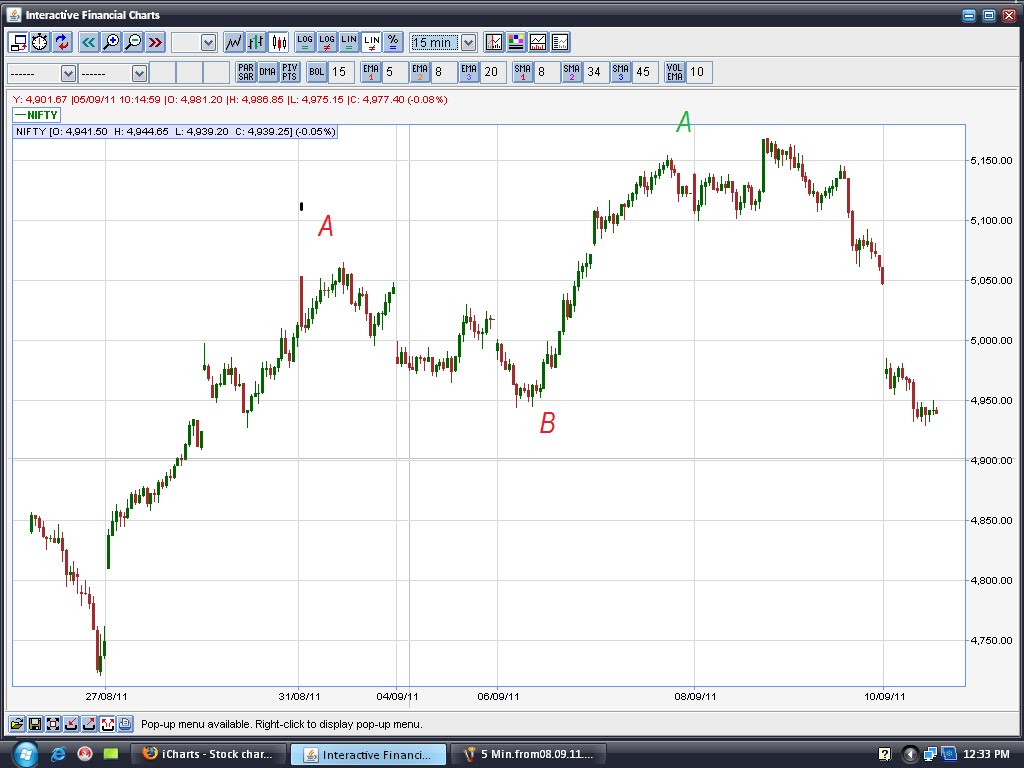
mkt had kept, it self with the bigger picture ..lefts many small waves so many times..it is because ,during the intraday time our mkt is running in line with the global mkts candle by candle,,,,, majority times,,,,or some times ignores the global mkt copmpletely and follows the ew counts.so we have to live with this kind of situation any how. .keeps us buisy to change our small wave counts according to running situation. if smaller wave count not match with the bigger one, and heavily ambiguous, than it is our duty to stick with the bigger counts,but for trading point of view we are swing traders so it does not harmful for us..
but for sharp entry exit points and sharp stoploss calculation,small 5 minutes or 15 minutes counts helps us enough.


Monday, September 19, 2011

Friday, September 16, 2011

16-9 after market prediction for 19-9 monday


market will try go get support at 5040,5060, level and than up move expected.tgt is 5180,5200 zone.

market left the down move


market left the expected move prescribed in last day's chart.so it had opened the positive count possibility shown here in hourly chart.considering eliott wave rules change in count is possible.

Bullish possibilty opened today

bullish possibility opened today,because market left the expected down move,so we have added new count possibilty also.now recent up from 4720 is either first wave of new bull run,or it is the ABC part of XX wave ,the temporary up wave in bearish market. till the last day it is only abc-x-abc kind xx wave.now from today with the necessary change in count bullish possibilty also opened.

Thursday, September 15, 2011

15-9 next day prediction


Tomorrow 16-9-2011 market will try to go down.5080,5100 is the level where we can identify mkt direction clearly.if mkt opens above this zone than buying zone start for tgt 5170,5225..most likely mkt will re test 4920 to 4880 tgt zone.

15-9 after market


Wednesday, September 14, 2011

Tuesday, September 13, 2011

gold target 1890 achieved, be ready for big correction.


gold weekly ,big correction on the way


waiting for 10 year up move's big correction.

13-9 after mkt


13-9 1minute 2nd update


after completing our first tgt 5030 mkt now at down ward move for 4900,4905,4910...and than again up move expected.tgt 4965,4970,4978...

13-9 15 MINUTES


13-9 SMALL 5 MINUTES


Tuesday, February 9, 2010

USA economy towards bankruptcy,usa economy in deep trouble says big peoples of world.

see all this world great traders and investors says about USA economy and stockmarket's next action.
February 5, 2010
US Government Will Go Bankrupt But Before That We Will Have High Inflation
“Maximum within 10 years time more than 35% of tax revenues will have to be used to pay the interest on the government debt and then you are in trouble – because then there will be not enough money out of the budget to pay for other stuff. I’m convinced the US government will go bankrupt, but not tomorrow. And before they go bankrupt, they’ll print money, and then you get high inflation rates, you have a depression and eventually they’ll go to war.”
in rt.comMarc Faber is an international investor known for his uncanny predictions of the stock market and futures markets around the world. Dr. Doom also trades currencies and commodity futures like Gold and Oil.

George Soros: Real Threat Of A Double Dip Recession In The United States
George Soros sees a real threat of a double dip recession in the United States because there is increasing concern about the budget deficit and the growing national debt and that diminishes the chances of additional stimulus:"The markets are now stabilized. The premiums have shrunk back to normal levels. So that's fine. And the economy has begun to move forward. But it's only moving forward because it's pushed by the stimulus. And that's particularly true in the United States. At the same time now, there's increasing concern about the budget deficit and the growing national debt. And that will stand in the way of additional stimulus. And that creates-- I think a real threat-- of a double
Feb 3, 2010

Paul Volcker`s Plan To Fix The Financial System
Paul Volcker exposed his plan to fix the financial system in a NY Times op-ed this weekend. Here are the plan`s highlights:1 - Prevent banks from owning hedge funds and other proprietary trading vehicles 2 - Give the government resolution authority to step in, liquidate, or sell any firm it deems to be in trouble3 - Make shareholders, management, and bondholders pay for any costs associated with thisThis plan is targeted to solve the "Too Big To Fail" issue. Under Volcker's plan, big firms would be allowed to fail in an orderly fashion, with their owners and lenders taking the hit.

Jan 24, 2010
Richard Russell: Very Bearish On The Stock Market Going Forward
Richard Russell, author of The Dow Theory Letters, is very bearish on the stock market going forward. This is an excerpt of his latest stock market comments:"The sinking market is taking a lot of late-arrivals along with it; These are the poor souls who bought stocks hoping to recoup some of the losses they suffered during 2008-09. The falling stock market, I believe, will turn consumers even more sceptical and bearish than they have been. Today, by the way, the Dow and the Transports both closed below their 50 day moving average, this for the first time since last November.Despite it all, I continue to believe that since March we have been in a bear market correction, and not a new bull market. For this reason, I take the current rotten market action very seriously. If I’m correct, it this is the beginning or a top-out in a bear market rally, then I can tell you that the “fun’s over,” and the really bad times lie ahead.What I’m now trying to decide is whether this is just a short-term correction or whether we are seeing a serious top-out of the rise from the March lows. A bearish turn of events would be an initial decline, then a weak rally and a second decline violating the lows of the first decline. In other words, a definitive downward pointing zig-zag.The Dow has now wiped out all of its 2010 gains and now shows a loss for the year, but more about the meaning of this tomorrow. Subscribers who wondered why I didn’t want to put the bull in the box may now see my hesitation. Bear market rallies turn on a dime, and in a few sessions you can be under water. I want my subscribers to be in the best shape possible if or when this market “has had it.” A few more weeks like this one, and we could see a real old-fashioned panic.The VIX is 22, which tells us that nobody has been buying puts. Confidence and complacency are the mood of the day. Nobody’s ready for a lousy market ahead."
February 3, 2010

Unemployment Is Up, Bankrupcies Continue To Increase In The US. So People Are Not Better Off.
"I want to remind you basically, if you ask me this is all part of a continuing. Yes, the stock market went up. You know, the american stock market is around 10,000 right now, the Dow Jones Average. It can go to 30,000 if they continue to print money. You think you made money because the Dow Jones tripled. But it has tripled in worthless paper. So we are not going to be better off and that is part of what is happening now. The stock market has gone up but the value of the money is deteriorating. Look at what has happened to the price of gold, or silver or some other commodities. They have been very strong because people know that the paper money is becoming less valuable. You may think that if the stock market goes to 20,000 you are better off, but you are not. The stock market is up a lot, around 50%. But unemployment is up, bankrupcies continue to increase in the US. So people are not better off. The stock market is better, stockbrokers are better because they have all the money. And that is not a good system. That is socialism for the rich."in

Praag Meeting
February 2, 2010
Jim Rogers, a native of Demopolis, Alabama, is an author, financial commentator and successful international investor. He has been frequently featured in Time, The Washington Post, The New York Times, Barron’s, Forbes, Fortune, The Wall Street Journal, The Financial Times, and most publications dealing with the economy or finance

Jan 17, 2010
Warren Buffett's Favorite Economic Indicator Shows Weak Economy
Warren Buffett's favorite indicator shows a weak US Economy:Rail traffic continues to show signs of a very tepid economic recovery as carloads and intermodal rail traffic got off to slow starts to the new year. Total carloads were off 12.7% compared to 2008 while intermodal traffic declined 3.6%. The breadth of the weakness continued to narrow, however, as 11 of the 19 commodity groups were up compared to 2008.This weakness in rail data was best displayed by yesterday’s Railtime Indicators Report from the AAR which showed the weakest annual rail data in over 20 years. While the sequential trend continues to improve there is little doubt that the recovery is still very weak.I would also like to add his recent comments about inflation, "the government's efforts to paper over the banking crisis are potentially very inflationary......worse than the 1970s inflation."


Thursday, September 10, 2009

market will start down ward move for 14100,200 first target.

market at decisive mode... sensex target is 16557.....now market very near to it. most likely market will start down ward move from it.lower target is 14100 and 12800,12700.
if market want to continue it's up ward move than it has to close above 16600,,,for two three days constant.which has very rare possibility.
see sensex at second tgt zone in between 16550 to 16700,this is predicted very earlier in this blog(see chart posted in june 5 earlier post.)
time to be cautious.most likely mkt will take some time here as dowjones tgt of 10000,10300 not achieved yet, interesting to see is our mkt wait for dow or takes it's own way(probable down wave),
one thing is sure before down ward move start,,, one good whipsaw zone dull narrow ranged trading zone,good distribution zone expected as smart money wants offload at higher lvl always.

Monday, August 17, 2009

range bound market.

All our last predictions prove right.
1.'''''
i had predicted 15600 and 16500,700 as tgt for up move start from 8050,nifty similar tgt from 2700 t0 4600,4700.this prove right sensex made our first tgt point to point 15600 and than start correction.
2."""
in the area of correction again bounce of 15000 predicted.
this is also prove right.
3."""
again predicted down ward move after 15000, sensex touch 15100 and than down for 13220.
(all the past this predictions posts available here in this blog)
now the market at big range consolidation zone ,the range is 3700 to 4900.
valuations are little bit at higher band but too much liquidity from fii side keeps our mkt at higher zone.
Dow Jones will play major role for our mkt next action.Dow 9500 is big resistance cross over of it will leads Dow at 10300,400,we have to watch Dow Jones at 9500 and than if Dow start for 10400 it's effect on our mkt.

Sunday, July 5, 2009

afraid to trade.com elliot wave counts. similar to our count....


,,,,,,,,,,,,,,,,,,,,,,,,,,,,,,,,,,,,,,,,,,,,,,,,,,,,,,,,,,,,,,,,,,,,,,,,,,,,,,,,,,,,,,,,,,,,,,,,,,,,,,,,,,,,,,,,,,Per multiple reader request (thank you to all my followers in India!), I am updating my analysis on Indias Nifty 50 Index, beginning this week with the long-term 10-year Monthly Structure.Lets take a quick look at a possible large-scale Elliott Wave count and also a Fibonacci Confluence (three price levels) chart on the monthly timeframe - a key turning point may be ahead soon.The market rallied sharply off the 2003 lows near 1,000 and peaked in January 2008 at a price high of 6,350 - an absolutely impressive rise to be sure.Look closely and you can see an arc rise (not drawn) off these lows as price went parabolicin its last few months - a classic warning of a top being formed.We see the Elliott Wave count (from 1 to 5) as the market rose 600% in value. We now appear to be in a corrective phase, and perhaps are finishing the (second) wave of a larger corrective move to retrace a larger portion of this price rise.This count would assume that the final Corrective wave down is on the horizon, which could take price back down to test the 2,500 level yet again in the months and perhaps next year to come.We have already retraced 61.8% of the move from the 2003 lows to the 2008 highs, so perhaps the corrective phase has run its course - that would be the alternate scenario.The alternatescenario would assume that instead of the 5-wave decline I have labeled as ,
instead had a complex corrective move down - perhaps in the order of ABC - X - ABC to end the correction, which places us squarely in Wave 1 now of a new bull market and expecting a corrective Wave 2 down (not to the lows - but perhaps to the 3,500 level) to begin.I think it counts better as a correction instead of a new bull market, but we need to be open to this possibility.Either way,
the Next Likely Swing appears to be a down one, whether it be the final Wave C or just a corrective Wave 2 - that is where I find Elliott Wave helpful - not in absolute forecasting, but in confluence counting in regards to the next likely swing.Speaking of confluence, lets take a look at a Confluence Fibonacci Grid using three price lows to begin our retracement to the closing high in January 2008.Two of the 3 grids overlap about the 4,400 level, which you see is exactly where price is located now.In fact, that is the only major overlapping confluence level we see using these grids on the chart.This implies that price is at a critical node and could be unable to overcome this confluence level to the upside - in other words, it could serve as key resistance.Last month also formed a Spinning Top candle, which is often seen and associated with key turning points in a market.As a caveat, there no guarantee of any absolute prediction into the future, but for now, we have the following
:
Possible Wave C (or Wave 2) down about to beginPrice at a critical Fibonacci Confluence Node around 4,400A Spinning Top candle formed in June on the confluence nodeA solid close above 4,800 and especially 5,000 would overrule these bearish omens, but until then, it might pay to be defensive on the long side at these levels
, understanding that the Nifty is at confluence resistance ties into the thesis that the S&P 500 is forming a possible reversal pattern down (Monthly signal and also Daily Head and Shoulders with momentum/volume divergences) - and adds a layer of confirmation that both markets appear poised for corrections)
.Corey Rosenbloom
CMTAfraid to Trade.com

Saturday, June 27, 2009

sensex at down trend


  • ,,,,,,,,,

  • after achieving our sharp tgt of 15600 now sensex at down move.running is b wave of down move.... c down wave remain...will bring down the mkt again at lower lvl..

Friday, June 5, 2009

Sunday, March 29, 2009

dow and sensex at big consolidation time,with good news support from US econonomy


dow jones and sensex at big consolidation zone, say nine months to one year.
This current rally is only one more bear mkt rally.
out of ten economy news 6 reamin with positive tick..
The measure is based on 10 components,six of which increased in February:
interest rate spread;
index of supplier deliveries;
building permits;
real money supply;
manufacturers' new orders for consumer goods and materials;
and manufacturers' new orders for non defense capital goods.
Some of those six indicators enjoyed surprising upticks in recent economic data.
Housing starts unexpectedly surged 22% February, after falling for eight months. It was the first time housing starts increased since June.
The remaining four components declined:
average weekly initial claims for unemployment insurance;
stock prices;
index of consumer expectations,
and average weekly manufacturing hours.
The components in decline aren't surprising after a slew of negative reports. The number of people filing initial claims for unemployment benefits fell slightly last week, but continuing claims hit a fresh record high of more than 5.47 million. The unemployment rate is up to 8.1%, the highest level in 25 years.
Stock prices rallied last week, but the Dow Jones industrial average is still down almost 50% from its peak in October 2007.Consumer confidence fell to a three-month low in February.
This good news support from US economics front will provide good support to dow jones to form bottom at 6400 lvl.this 6400 is most likely the final bottom for dow,similarly our mkt will also form bottom around 7200 to 7500 sensex zone But majority time, movement zone will in between 2500 to 3200 in terms of nifty.those who are waiting for 3200 above move will find it any way for next sixth months time atleast.With lots of whipsaws, with common tech tools, this time will prove most challanging time for traders.
see small wave count of dow and sensex.
also see the sensex flat running which is earlier posted in my this blog at 9th feb.now this possibility comes true.follow this count now.

Thursday, March 19, 2009

dow at big consolidation zone


..........Dow jones now at big time frame consolidation zone. see the possible wave structure for future prediction,,

all suggests next days for time pass corrections only.

our mkt had started time pass correction earlier than world's other mkts.

i am expecting next one year range bound consolidation in all world mkts.

this will effect in our mkt move also, expecting flat or more big triangle perhaps descending,,,most likely flat correction in between 2550 to 3150 on the way....

one thing is sure we are at 4th wave of C ,,,,, till the date and,, no any sign of start of fifth wave.

ew count for US MKTalso from some big ew analysts of USA,,,

main problem of their count is it's not match with fibonacci no. for more details visit afraid to trade blog for these counts, links avilable in this blog.(see their count posted here)

there are two different type of counts available but both are not match with fibonacci properly.,,,, that is why my count differe from them, which is exactly match with fibonacci and other rules of elliot waves.

Wednesday, December 10, 2008

Friday, December 5, 2008

Thursday, November 27, 2008

Friday, November 21, 2008

dow 6450 prediction


see dows first gt prediction of 7200 and 6450 posted at vfm direct forum

past records


see this 2250 prediction prove right this is not posted in this blog....

i am posting many predictions in many forums...

Saturday, September 27, 2008

MARKET OUTLOOK 27-9-2008


This week bail out plan from bush and Washington mutual fund sold out news had great impact on our as well as worlds markets.market now more dependant on news because market want good tonic here to prevent further damage.now every one feared with the big recession like in 1929, in us market probability.last two three months in between some good news from economy front such as consumer spending,factory purchase order job creation increasement other than housing sector etc ,but now a days they all turns bearish.out of 10 economy news now 9 is bad .so all top executives including president bush now in dip worried about next coming days.all are doing their best.

but q is their try will succeed to prevent great recession in USA.

mark faber said last day,us property and mortgage mkt is far more in dip trouble and this bail out plan money can be effective only in small part of this big problem.

our Indian nuclear deal also not pass till the date.but it will pass easily some formality remain only.

technically we are 4Th wave 's inside b wave. after this b over some up side remain to complete the formation.for the tgt at upper line drawn on chart.

after this 4Th over fifth down wave pending this can go at least 80% of this 4Th wave.most likely it will end above 3800.because of this overlapping in 4Th wave.4Th entered in 2 wave area. and development in us market.

Saturday, September 20, 2008

sensex latest chart


market out look for next week

last week unexpected news from Lehman brothers denial from us govt spoiled the game of bulls .now this is clear bearish market for long term view this will continue for long term .all the economics news from us market continue bad.
in between bull market can not rule out ,now onwards there is possibility of intermediate good bull period (bear market rally)but this means not the end of bearish period and start of new bull run.see my post posted in vfm forum also.
i am not highly bearish considering our economy strengths.
technically we are at ABC x ABC at c wave of last ABC.
see the chart is suggesting after this five wave of last c wave over, new up wave will soon start.

Saturday, September 13, 2008

market outlook


technical view.......

despite of all bearishness in world market our market able to sustain at higher lvl.compare to other Asian markets we not joined with them.see Dow and ftse able to save their last low made in July.but Nikkei,hengseng and other markets failed to do this.major reason for this is Nikkei joined later to complete it's c wave and other Asians heavily follows Nikkei.that is why they continue down and down..our market at present with the ftse and dow yes our chart follows their formations ,but major difference is we are strongest among these three.means in all world market we are strongest. this shows investor's faith in our market.
technically our market as well as Dow and ftse at sideways kind of market.ABC x ABC formation continue in all this three markets.
the lower range is 4160 4200 in nifty and 13800,14000 in sensex where you can buy easily. upper range is nifty 4550,4650.

fundamental view;....

bear market lower range is 14,15 PE band and upper range is 25 to 30 PE band.
at present we are at lower band of sensex PE at 14,15 near.
sensex this year earnings are 850 easily achievable and this estimate will give positive surprise to fund managers.
sensex next year estimate is 950 to 1000 EPST is giving us discounted target for sensex for lower band near 12500 to 14000 and for upper band 22000 to 25000.for next year march ending tgt.
our GDP growth will remain in the range of 7 to 9%,this is far more better than other emerging markets.except china.
our companies delivering good results and no any negative surprises till the date from corporates front.their estimated profit right on the tgt.
we are at the upper range of the interest cycle and inflation cycle so correction needed in all asset class.particularly in real estate,commodities and equity.


equity;....


corrected well and now fundamentally no need of further correction as its prices are fundamentally vary attractive compare to other world markets fundamental performence, at this lower p-e band no other market able to give good return equal to india..considering future growth of India and corporate performance money flow form world will start any time when their blocked liquid start to ease.at present fund managers main duty is to sustain our market at this lvl without more correction till the new fund flow start.


commodities;.....


commodities bubble finally burst and had started correction for at least six month time period.this will ease the inflation problem for our as well as all other world's emerging markets.this will result in interest rate down.and this will vary positive fornext coming years corporate performance.

real estate....
prices in Indian real estate are far out of reach for common people this is worst
problem for our economy now.in fact this will prove worst problem for next two three year for Indian economy.this will prove major hurdle for next year.land prices need to soft further.

Tuesday, August 5, 2008

TIME TO BE OPTIMISTIC

Yes, the financial news gets worse every day. Yes, the average stock is down more
than 25% over the past thirteen months. Yes, the housing market is still reeling and
foreclosure activity is rising. Yes, the price of gas is skyrocketing. And yes, this too
will pass, and the economy and stock market will begin a new expansion and
sustainable bull market, as all business cycles have. Over our several decades of
investment management experience, we have witnessed many business cycle
recessions and stock market declines. They all have one thing in common. In the
midst of the most negative financial news, the stock market (fulfilling its role as an
accurate leading economic indicator) begins to move higher in anticipation of the
next economic recovery. We believe the market has more than discounted all
the bad news out there and is putting the finishing touches on the bottoming
process for stocks. Yes, a significant advance is set to begin that will take stocks
much higher in the year ahead.
Considering all the negative financial headlines, is it any wonder investor psychology
has reached a gloomy extreme? Legendary value investor and philanthropist
Sir John Templeton made a career (and fortune) taking advantage of bargains that
showed up during recessionary periods and bear markets. His foremost investment
discipline was geared to wait patiently for stock prices to “reach the point of maximum
pessimism” and then he invested. It is somewhat
ironic that this pioneer of value investing, who
began his career in the 1930’s, would pass away
this month at the age of 95, just when the markets
have hit an emotional low point. We know Sir John
would be buying stocks during today’s financial
turmoil. Investor psychology has reached that
pessimistic extreme and conversely sets up the year
ahead to be a very profitable one. In the remainder of this newsletter, we expand on
four potent reasons to support our forward-looking optimism.
FOUR KEY REASONS TO BE OPTIMISTIC TODAY
1. Low Consumer Confidence = Profits Ahead
2. Bull Markets Always Follow Bear Markets
3. Lower Oil Prices Ahead
4. Record Cash Levels on Sidelines
“Bull markets are born on
pessimism, grow on
skepticism, mature on
optimism, and die on
euphoria.”
Sir John Templeton
1600 S.


Reason #1: Low Consumer Confidence = Profits Ahead
This may at first sound a bit counterintuitive, but the good news is American consumers’ level of
confidence has reached a 28-year low. How can that possibly be good news? In the 40-year
history of gauging consumer confidence, whenever attitudes tumble to this pessimistic extreme,
stocks have already greatly digested and discounted the bad news. As detailed in the chart and
table, we have identified six prior times when consumer confidence had fallen to this extreme
low level. Each time, despite all the bad news, a new bull market for stocks began and
significant stock market gains followed. We expect this seventh episode to end profitably as well.


Reason #2: Bull Markets Always Follow Bear Markets
To add perspective to current market conditions, we have compiled information summarizing
past bull and bear market cycles since 1960. Since then, there have been 11 bear markets with
each followed by new long term bull markets. Please take some time to study the table of information
on the accompanying page, particularly the “News Events of the Day” column. There are
two key points about bear markets we would like to highlight: First, investors are always faced
with intensely negative news and many times a “crisis atmosphere” which pushes stock prices
temporarily lower; second, bull markets begin in the middle of all the bad news. Historically
the bull markets rewarded investors with gains on average exceeding 90%.

Reason #3: Lower Oil Prices Ahead
$40
$3
$145
Major Positive Surprise – Lower Oil Prices Ahead!
$11
?
$145
$40
$11
$3
Crude Oil
A major factor influencing consumer pessimism is oil prices have doubled in the last year. At every
level of spending, consumers are feeling pain of higher energy costs, whether it is filling the car up
with gas or buying groceries. Any relief from spiraling energy costs would be a major step toward
improving investor psychology. Looking at our chart of the 120-year history of oil prices, clearly the
recent price gains are at unsustainable levels. The chart depicts oil prices and our long-term momentum
tool (6 year rate of change) showing only two other times in history oil prices have been this
stretched. Each time was followed by a significant price decline. While others are projecting $200
oil, our tools and research suggest an important turning point forecasting lower prices. We think
the most likely outcome will be a significant decline in oil to $100 or lower before the year is
over. This positive surprise for investors will be a major catalyst for the next bull market lift-off.

Reason #4: Record Cash Levels on Sidelines
Ratio of Cash to U. S. Stock Value
Money Market
Funds $3.36 Trillion
Total Value $12.39 Trillion
U. S. Stocks
or =
Cash to Market Value at 27%
is the Highest Level Ever !
Fuel for Bull Market Liftoff
Another positive sign is the enormous cash pile investors have sitting in money market funds.
This record amount of cash is fuel for the next bull market advance. In fact, cash levels in money
funds as a percent of the total value U.S. stocks equals a record high 27%! This level is higher
than the start of any bull market of the past 30 years. A little improvement in the news, an end
to the oil price spike, and a shift in investor attitudes toward optimism will open the floodgates
of money fund assets flowing back into stocks. A virtuous cycle can begin once again.

Conclusion
In this expanded newsletter we have laid out four key reasons to expect a strong stock market
going forward. Consistent with our January newsletter message, we expected 2008 would be a
transition year from bear market to new bull market. We have arrived at that important transition
point. History shows that just as day follows night, bull markets always follow bear markets. Itis time to be optimistic!